

Objective 5.2 – Monitor a VMware NSX Implementation
Skills and Abilities
• Configure logging for NSX components according to a deployment plan
• Monitor health of networking services
• Monitor health and status of infrastructure components:
- vSphere
- NSX Manager
- Control Cluster
• Enable data collection for single/multiple virtual machines
Configure logging for NSX components according to a deployment plan
To configure logging for our ESXi host, navigate to the host and click Configure > Advanced System Settings. You can click Edit and search for syslog. Edit the settings for Syslog.global.logHost and enter in your syslog server’s FQDN or IP and port number.

Next, we can move on to our NSX Manager and configure syslog there. Log in to the NSX manager and click Manage Appliance Settings > Manage > Settings > General and click Edit next to Syslog Server

Enter in the information for your Syslog server and click OK.
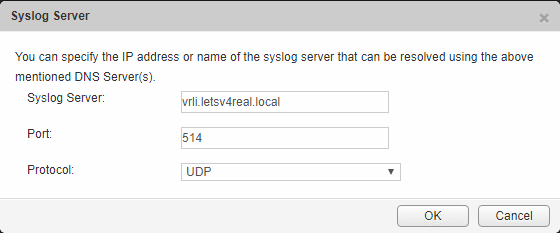
Next we are going to configure syslog on a NSX edge device. Navigate to Networking & Security > NSX Edges > Double click your edge device > Manage > Settings > Configuration. Under the Details section, click Change next to Syslog servers
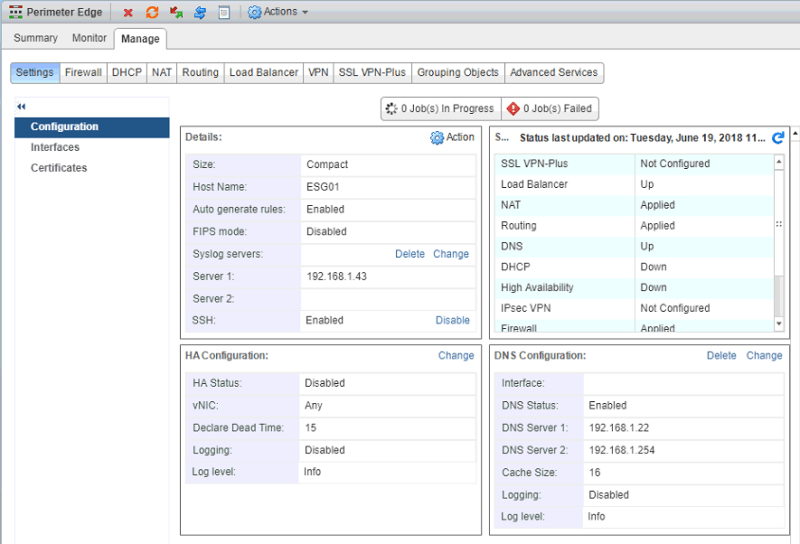
Enter in your Syslog server details. Click OK.

Monitor health of networking services
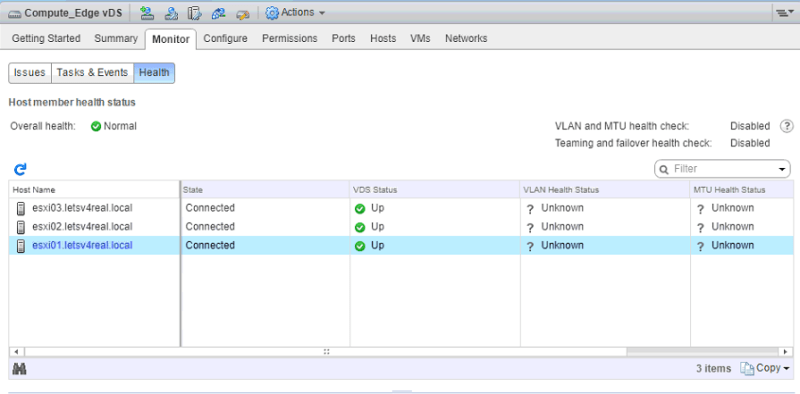
I’m not quite sure exactly what they are looking for here but checking the distributed switch health is what I thought about since we are going to check the health of other components in the next section. To check the vDS health, go under the Networking view in vCenter. Click the vDS. Under Monitor > Health, you will see the health of your NSX distributed switch
Monitor health and status of infrastructure components
vSphere:
Here are a few sections that can be checked for vSphere:
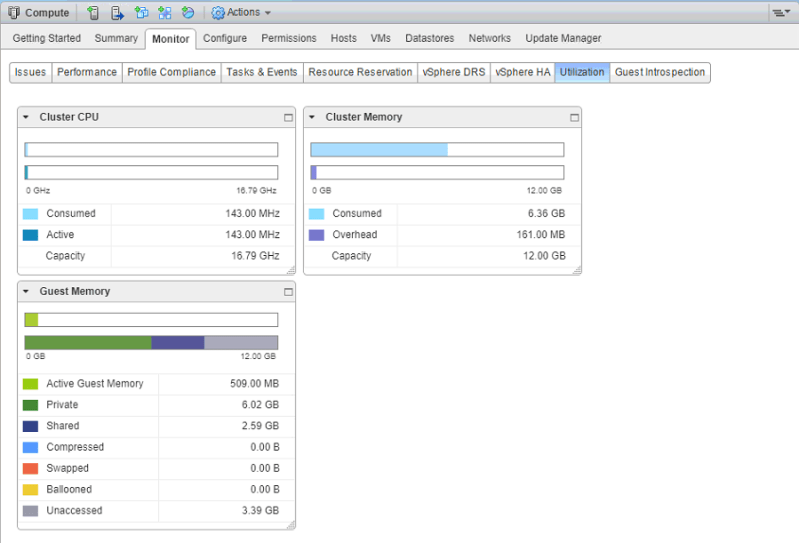
The main summary section of a cluster:

Also under the Monitor > Utilization, you get a summary of the cluster resources being used.
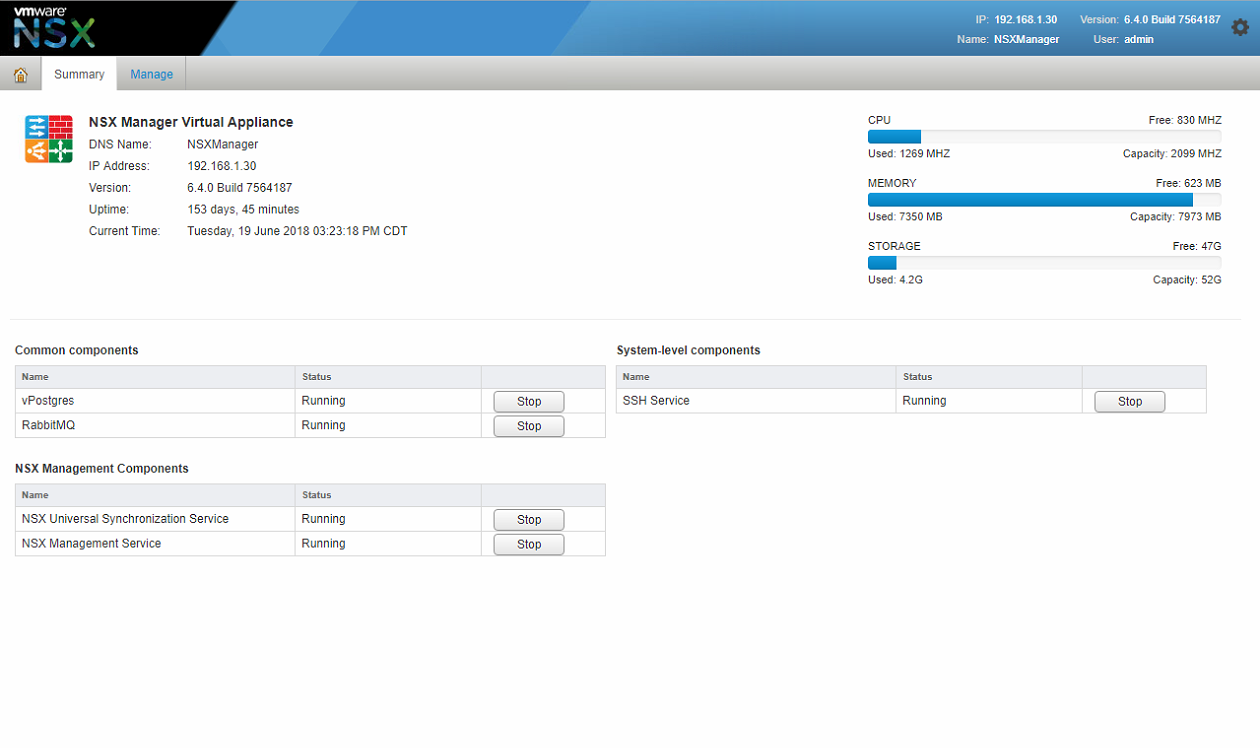
NSX Manager
Log into the NSX Manager and click Summary
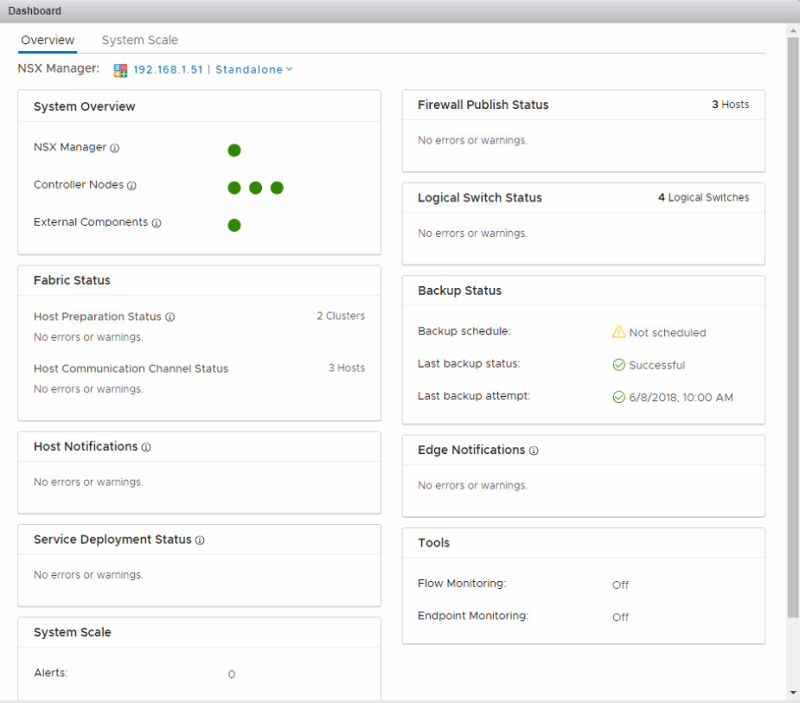
 If you go to the web client and click Dashboard (this is for NSX 6.4) you can see a overall status of the system
Control Cluster
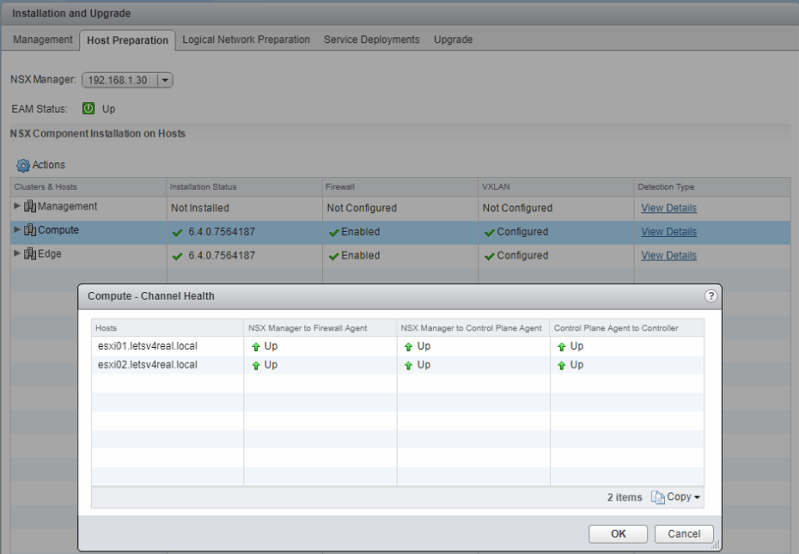
To check the controllers, navigate to Networking & Security > Installation and Upgrade (NSX 6.4) > Management. You will see the status of the controllers. Each controller should show connected and display the other peer controllers that it is connected to

Also under Host Preparation, we can check the communication channel health of the clusters that are prepared for NSX by clicking Actions > Communication Channel Health.
Enable data collection for single/multiple virtual machines
I’ve covered in a previous blog post, so instead of writing this all over again, I’ll just reference that section from the Service Composer blog post:
As of NSX 6.3, Activity Monitoring has been deprecated. VMware recommends using Endpoint Monitoring. So in this section I will be going over configuring endpoint monitoring. Endpoint monitoring enables you to be able to map specific processes inside the guest OS to the network connections the processes are using. In order to use Endpoint Monitoring, you must first have Guest Introspection services deployed in your environment and have the complete install of VMware tools installed on your VMs.

Once that is done, navigate to Networking & Security > Tools > Endpoint Monitoring. Click Start Collecting Data.

Click Select you security group here

Select the Security Group you want to perform data collection on. Click OK.

Switch data collection on. Click OK.

Now we see that data collection is enabled. It can take some time for actual data to start appearing in the different sections, so give it some time.

Below are a few screenshots of the various views and information that it provides. The summary gives us a overview of the number of VMs running and how many processes are generating traffic on those VMs.

Under the VM Flows tab you can see various other traffic flows between a member in my security group and other devices.

If you click the bubble of the VM in the chart, you will see a list of the processes that are generating traffic

If you click on the lines between the VM and another devices, you will see what traffic is happening between those two devices

